Understanding Technical Analysis for Cryptocurrency

- Introduction to Technical Analysis
- Key Concepts of Technical Analysis
- Common Technical Indicators for Cryptocurrency
- How to Use Technical Analysis to Predict Price Movements
- Benefits and Limitations of Technical Analysis for Cryptocurrency
- Tips for Beginners in Technical Analysis
Introduction to Technical Analysis
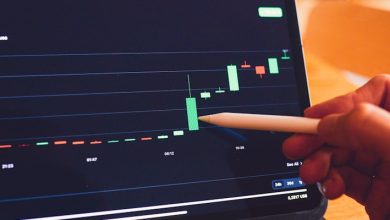
Technical analysis is a method used to evaluate investments and make trading decisions based on statistical trends. In the context of cryptocurrency, technical analysis involves analyzing historical price data to predict future price movements. By studying charts and identifying patterns, traders can gain insights into potential price movements and make informed decisions.
Key Concepts of Technical Analysis
Technical analysis is a method used to evaluate investments and identify trading opportunities by analyzing statistical trends gathered from trading activity, such as price movement and volume. When it comes to cryptocurrency, understanding key concepts of technical analysis can help traders make informed decisions based on historical price data and market behavior.
- Trend Analysis: One of the fundamental principles of technical analysis is trend analysis, which involves identifying patterns in price movements that can help predict future price direction.
- Support and Resistance: Support levels indicate a price point where a cryptocurrency is likely to stop falling and reverse, while resistance levels indicate a price point where it is likely to stop rising and reverse.
- Moving Averages: Moving averages are used to smooth out price data and identify trends over a specific period of time. Traders often use moving averages to confirm trends and determine entry and exit points.
- Relative Strength Index (RSI): The RSI is a momentum oscillator that measures the speed and change of price movements. It can help traders determine overbought or oversold conditions in the market.
- Candlestick Patterns: Candlestick patterns are graphical representations of price movements that can help traders identify market sentiment and potential trend reversals.
By incorporating these key concepts into their analysis, cryptocurrency traders can gain a better understanding of market dynamics and make more informed decisions. It is important to note that technical analysis is not foolproof and should be used in conjunction with other forms of analysis to mitigate risks and maximize profits.
Common Technical Indicators for Cryptocurrency
When it comes to analyzing cryptocurrency markets, technical indicators play a crucial role in helping traders make informed decisions. There are several common technical indicators that are widely used in the cryptocurrency space. These indicators provide valuable insights into the price movements of various cryptocurrencies, helping traders identify trends and potential entry and exit points for their trades.
One of the most popular technical indicators used by cryptocurrency traders is the Moving Average (MA). Moving averages smooth out price data to help identify trends over a specific period. Traders often use the 50-day and 200-day moving averages to determine the overall trend of a cryptocurrency.
Another common technical indicator is the Relative Strength Index (RSI). The RSI measures the speed and change of price movements and helps traders determine if a cryptocurrency is overbought or oversold. An RSI above 70 is typically considered overbought, while an RSI below 30 is considered oversold.
The Moving Average Convergence Divergence (MACD) is also a widely used technical indicator in cryptocurrency trading. The MACD helps traders identify changes in the strength, direction, momentum, and duration of a trend. Traders use the MACD to generate buy and sell signals based on crossovers between its two lines.
Bollinger Bands are another popular technical indicator that helps traders identify volatility and potential price breakouts. Bollinger Bands consist of a simple moving average and two standard deviations, creating a price channel that helps traders identify overbought and oversold conditions.
Overall, understanding and utilizing common technical indicators can greatly enhance a trader’s ability to analyze cryptocurrency markets and make well-informed trading decisions. By incorporating these indicators into their technical analysis, traders can gain a better understanding of market trends and potentially improve their trading outcomes.
How to Use Technical Analysis to Predict Price Movements
Technical analysis can be a valuable tool for predicting price movements in the cryptocurrency market. By analyzing historical price data, traders can identify patterns and trends that may indicate future price movements. Here are some key strategies for using technical analysis to predict price movements:
- 1. **Identify Trends:** One of the fundamental principles of technical analysis is to identify trends in price movements. By looking at historical price data, traders can determine whether a cryptocurrency is in an uptrend, downtrend, or trading sideways.
- 2. **Use Technical Indicators:** Technical indicators are mathematical calculations based on price, volume, or open interest data. These indicators can help traders identify potential entry and exit points for trades.
- 3. **Support and Resistance Levels:** Support and resistance levels are price levels at which a cryptocurrency tends to find buying or selling pressure. By identifying these levels, traders can make more informed decisions about when to enter or exit a trade.
- 4. **Chart Patterns:** Chart patterns, such as head and shoulders, triangles, and flags, can provide valuable information about where a cryptocurrency may be headed next. Traders can use these patterns to anticipate price movements and adjust their trading strategies accordingly.
- 5. **Volume Analysis:** Volume is a key indicator in technical analysis, as it can help confirm the strength of a trend. Increasing volume during an uptrend, for example, may indicate that the trend is likely to continue.
By incorporating these strategies into their trading routine, traders can use technical analysis to gain a better understanding of price movements in the cryptocurrency market and make more informed trading decisions.
Benefits and Limitations of Technical Analysis for Cryptocurrency
Technical analysis for cryptocurrency offers several benefits for traders looking to make informed decisions. By analyzing historical price data and volume, traders can identify patterns and trends that may help predict future price movements. This can be especially useful in the volatile cryptocurrency market where prices can change rapidly.
One of the main advantages of technical analysis is its ability to provide traders with entry and exit points for their trades. By using tools such as moving averages, support and resistance levels, and chart patterns, traders can make more informed decisions about when to buy or sell a particular cryptocurrency.
However, technical analysis also has its limitations. It is not a perfect science and there is always a degree of uncertainty when it comes to predicting future price movements. Additionally, technical analysis does not take into account external factors such as news events or regulatory changes, which can have a significant impact on cryptocurrency prices.
Despite its limitations, technical analysis can still be a valuable tool for cryptocurrency traders when used in conjunction with other forms of analysis. By combining technical analysis with fundamental analysis and market sentiment, traders can make more well-rounded and informed trading decisions.
Tips for Beginners in Technical Analysis
For beginners in technical analysis, it is important to start with the basics and gradually build up your knowledge and skills in analyzing cryptocurrency trends. Here are some tips to help you get started:
- Learn the key concepts: Familiarize yourself with terms such as support, resistance, trend lines, and indicators.
- Practice with demo accounts: Use demo trading accounts to practice your technical analysis skills without risking real money.
- Focus on a few indicators: Instead of overwhelming yourself with too many indicators, start with a few that you understand and can interpret effectively.
- Study historical data: Analyze past price movements to identify patterns and trends that can help you make better predictions.
- Stay updated: Keep abreast of news and events that may impact the cryptocurrency market to make informed decisions based on both technical and fundamental analysis.
By following these tips and consistently practicing your technical analysis skills, you can become more confident in analyzing cryptocurrency trends and making informed trading decisions.